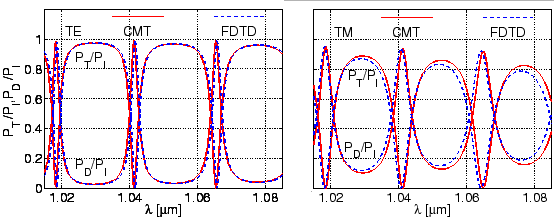
Figure 4.2 shows the spectral response for a microring-resonator
made of two couplers as considered in Section 3.4.1, with cavity radius
![]() m and gaps
m and gaps
![]() m. The CMT calculations use the
computational setting as introduced for Figure 3.3. One
observes the familiar ringresonator resonance pattern with dips in the
transmitted power and peaks in the dropped intensity. According to
Figure 3.4, the present parameter set specifies configurations with
rather strong interaction in the coupler regions (
m. The CMT calculations use the
computational setting as introduced for Figure 3.3. One
observes the familiar ringresonator resonance pattern with dips in the
transmitted power and peaks in the dropped intensity. According to
Figure 3.4, the present parameter set specifies configurations with
rather strong interaction in the coupler regions (
![]() (TE),
(TE),
![]() (TM)), such that the resonances are relatively wide, with a substantial amount
of optical power being directly transferred to the Drop port also in off
resonant states. These properties are related to the attenuation of the cavity
modes, and to the interaction strength in the coupler regions, i.e. to the
radial confinement of the bend fields, hence one finds resonances of lower
quality for TM polarization, and a decrease in quality with growing wavelength
for both TE and TM polarized light.
(TM)), such that the resonances are relatively wide, with a substantial amount
of optical power being directly transferred to the Drop port also in off
resonant states. These properties are related to the attenuation of the cavity
modes, and to the interaction strength in the coupler regions, i.e. to the
radial confinement of the bend fields, hence one finds resonances of lower
quality for TM polarization, and a decrease in quality with growing wavelength
for both TE and TM polarized light.
 |
The CMT results are compared with FDTD simulations, where a computational
window that encloses the entire resonator device has been discretized by a
rectangular grid of
![]() points along the
points along the ![]() - and
- and
![]() -directions with uniform mesh size of
-directions with uniform mesh size of
![]() m. The boundaries of the
computational window are enclosed by
m. The boundaries of the
computational window are enclosed by
![]() m wide perfectly matched layers
with quadratically varying strength, which provide a reflectivity of
m wide perfectly matched layers
with quadratically varying strength, which provide a reflectivity of ![]() for the central wavelength
for the central wavelength
![]() m. The simulations are carried
out over a time interval of
m. The simulations are carried
out over a time interval of
![]() ps with a step size of
ps with a step size of
![]() fs. According to the left and right plots of
Figure 4.2, we find an excellent agreement between the CMT and the
FDTD results for TE polarization, and only minor deviations for the TM case
with less regular fields, more pronounced radiation, and stronger interaction
in the coupler regions, where apparently the assumptions underlying the CMT
approach are less well satisfied. Note that already in the present 2-D setting
these FDTD calculations typically require a computation time of several hours,
while the CMT analysis (with interpolation) predicts the entire spectrum in
just a few minutes.
fs. According to the left and right plots of
Figure 4.2, we find an excellent agreement between the CMT and the
FDTD results for TE polarization, and only minor deviations for the TM case
with less regular fields, more pronounced radiation, and stronger interaction
in the coupler regions, where apparently the assumptions underlying the CMT
approach are less well satisfied. Note that already in the present 2-D setting
these FDTD calculations typically require a computation time of several hours,
while the CMT analysis (with interpolation) predicts the entire spectrum in
just a few minutes.