 |
 |
The CMT simulations of the couplers are carried out on computational windows
of
![]() , if
, if
![]() m, otherwise on a window
m, otherwise on a window
![]() , discretized with stepsizes of
, discretized with stepsizes of
![]() m
and
m
and
![]() m. For the two basis fields the CMT analysis generates
m. For the two basis fields the CMT analysis generates
![]() transfer matrices
T and scattering matrices
S
that can be viewed as being
transfer matrices
T and scattering matrices
S
that can be viewed as being ![]() -dependent in the sense as discussed in
Section 3.4. Figure 3.3 shows the evolution of the
matrix elements with the position
-dependent in the sense as discussed in
Section 3.4. Figure 3.3 shows the evolution of the
matrix elements with the position
![]() of the coupler output plane.
of the coupler output plane.
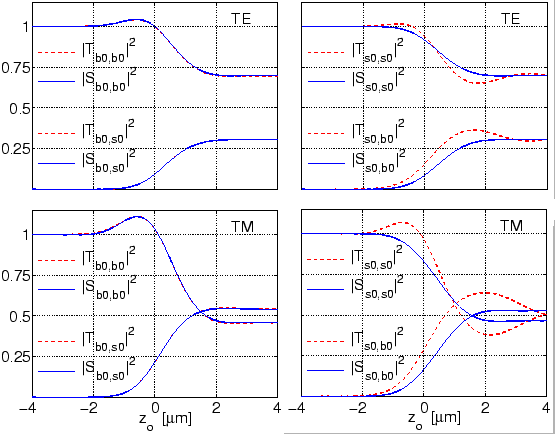 |
The matrix elements
![]() and
and
![]() relate the amplitudes of an input mode
relate the amplitudes of an input mode
![]() to an output mode
to an output mode ![]() ; for the present normalized modes the
absolute squares can thus be viewed as the relative fractions of optical power
transferred from mode
; for the present normalized modes the
absolute squares can thus be viewed as the relative fractions of optical power
transferred from mode ![]() at the input plane
at the input plane
![]() to mode
to mode
![]() at the output plane
at the output plane
![]() of the coupler. After an
initial interval, where these quantities remain stationary, one observes
variations around the central plane
of the coupler. After an
initial interval, where these quantities remain stationary, one observes
variations around the central plane ![]() of the coupler, which correspond to
the interaction of the waves. Here the nonorthogonal basis fields are strongly
overlapping; it is therefore not surprising that the levels of specific
components of
of the coupler, which correspond to
the interaction of the waves. Here the nonorthogonal basis fields are strongly
overlapping; it is therefore not surprising that the levels of specific
components of
![]() and
and
![]() exceed
exceed ![]() in this interval.
in this interval.
After the region of strongest interaction, near the end of the
![]() -computational interval, one finds that the elements
-computational interval, one finds that the elements
![]() that map to the bend mode amplitude become
stationary again, while the elements
that map to the bend mode amplitude become
stationary again, while the elements
![]() related
to the output to the straight mode still show an oscillatory behaviour.
This is due to the interference effects as explained in
Section 3.2.3. The proper amplitudes of the modes of the
bus channel can be extracted by applying the projection operation
(3.19); the corresponding matrix elements
related
to the output to the straight mode still show an oscillatory behaviour.
This is due to the interference effects as explained in
Section 3.2.3. The proper amplitudes of the modes of the
bus channel can be extracted by applying the projection operation
(3.19); the corresponding matrix elements
![]() attain stationary values, such that the ``coupling strength'' predicted for the
involved modes does not depend on the (to a certain degree arbitrary) position
of the coupler output plane.
attain stationary values, such that the ``coupling strength'' predicted for the
involved modes does not depend on the (to a certain degree arbitrary) position
of the coupler output plane.
Anyway, the scattering matrix
S, that enters the relations
(1.4), (1.5) for the transmission properties of
the resonator device, should be considered a static quantity, computed for the
fixed computational interval
![]() . From the design
point of view, one is interested in the elements of this matrix (the
``coupling coefficients'') as a function of the resonator / coupler design
parameters. Figure 3.4 summarizes the variation of
S with the width of the coupler gap, for a series of different bend radii.
. From the design
point of view, one is interested in the elements of this matrix (the
``coupling coefficients'') as a function of the resonator / coupler design
parameters. Figure 3.4 summarizes the variation of
S with the width of the coupler gap, for a series of different bend radii.
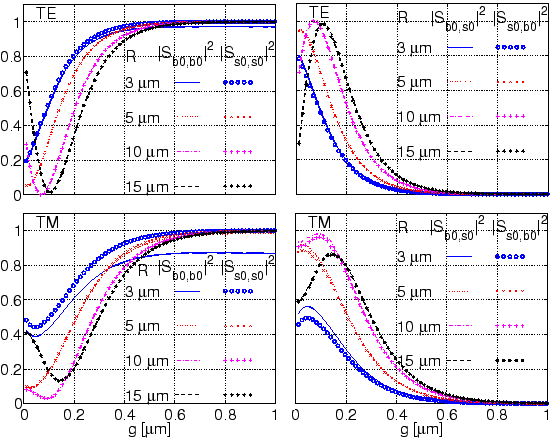 |
Uniformly for all radii and for both polarizations one observes the
following trends. For large gap widths, the non-interacting fields lead
to curves that are constant, at levels of unity
(
![]() , full
transmission along the straight waveguide), moderately below unity
(
, full
transmission along the straight waveguide), moderately below unity
(
![]() , attenuation of the isolated bend
mode, stronger for the TM field), or zero
(
, attenuation of the isolated bend
mode, stronger for the TM field), or zero
(
![]() and
and
![]() , decoupled fields).
As the gap width decreases, the growing interaction strength
between the modes in the two cores causes increasing cross coupling
, decoupled fields).
As the gap width decreases, the growing interaction strength
between the modes in the two cores causes increasing cross coupling
![]() ,
,
![]() and decreasing self coupling
and decreasing self coupling
![]() ,
,
![]() .
This continues until a maximum level of power transfer is attained
(where the level should depend on the ``phase mismatch''
between the basis fields, though a highly questionable notion in case of the
bend modes [114]).
.
This continues until a maximum level of power transfer is attained
(where the level should depend on the ``phase mismatch''
between the basis fields, though a highly questionable notion in case of the
bend modes [114]).
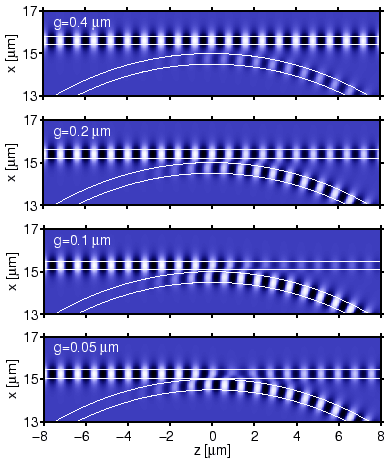
If the gap is further reduced, the cross coupling coefficients decrease, even if a growing strength of the interaction can be expected; the decrease can be attributed to a process of ``forth and back coupling'', as shown in Figure 3.5, where along the propagation axis a major part of the optical power changes first from the input channel to the second waveguide, then back to the input core. One should therefore distinguish clearly between the magnitude of the coefficients (3.8) in the differential equations that govern the coupling process, and the solution of these equations for a finite interval, the net effect of the coupler, represented by the scattering matrix S.
 |
For the symmetric computational windows used for the present simulations,
the abstract reasoning of Section 3.3 predicts symmetric
coupler scattering matrices. According to Figures 3.3 and
3.4, this constraint is respected remarkably well by the CMT
simulations. In Figure 3.3, the curves related to
![]() and
and
![]() end in nearly the same level at
end in nearly the same level at
![]() . Figure 3.4 shows pairs of close curves for the cross coupling coefficients, where larger deviations occur only for rather extreme
configurations with small bend radii and gaps close to zero;
the deviations are more pronounced for the TM case. Here one might question
the validity of the assumptions underlying the CMT ansatz (3.3).
Otherwise the symmetry of the scattering matrices provides a useful means
to assess the accuracy of the CMT simulations, beyond merely the power balance
constraint.
. Figure 3.4 shows pairs of close curves for the cross coupling coefficients, where larger deviations occur only for rather extreme
configurations with small bend radii and gaps close to zero;
the deviations are more pronounced for the TM case. Here one might question
the validity of the assumptions underlying the CMT ansatz (3.3).
Otherwise the symmetry of the scattering matrices provides a useful means
to assess the accuracy of the CMT simulations, beyond merely the power balance
constraint.
In the ``standard resonator model'', as seen from Eqs. (1.4), (1.5), the spectral response of the resonators depends on the scattering matrix entries. Therefore it is useful to look at the wavelength dependence of the scattering matrix, which is shown in the plots of Figure 3.6 and 3.7.
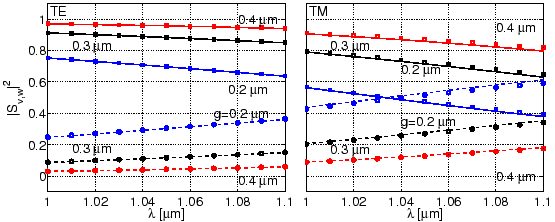 |
Note that the scattering matrix entries are complex numbers. While the absolute square of these entries, as shown in Figure 3.6, shows a monotonic behaviour, the corresponding real and imaginary parts, shown in Figure 3.7, oscillate. These oscillations are due to phase changes experienced by the modal fields while propagating along the coupler. We will elaborate this point further in Section 4.3, with a numerical example in Section 4.4.1.
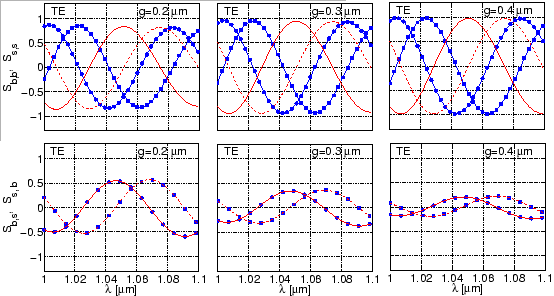 |
As the wavelength increases, the bent waveguide and straight waveguide modes
become less confined, and the interaction between these modes increases. This
results in a steady increase of the cross coupling coefficients
![]() ,
and a decrease of the self coupling coefficients
,
and a decrease of the self coupling coefficients
![]() . For varying
wavelengths and for both polarizations, the simulation results in
Figures 3.6 and 3.7 show that reciprocity is
maintained very well, i.e. the cross coupling coefficients
. For varying
wavelengths and for both polarizations, the simulation results in
Figures 3.6 and 3.7 show that reciprocity is
maintained very well, i.e. the cross coupling coefficients
![]() and
and
![]() coincide as complex numbers (see the plots in the second row of
Figure 3.7). Slight deviations can be observed for the
configurations with
coincide as complex numbers (see the plots in the second row of
Figure 3.7). Slight deviations can be observed for the
configurations with
![]() m and TM polarization, for the structure with
the strongest interaction and lossy, less regular fields.
m and TM polarization, for the structure with
the strongest interaction and lossy, less regular fields.