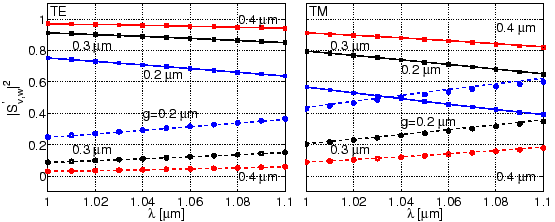
As the bend modes in the present coupler are not that lossy (see
Figure 3.2), the plots of the absolute square of
![]() in Figure 4.3 do not differ much from
in Figure 4.3 do not differ much from
![]() in
Figure 3.6, although for the TM modes one can observe a
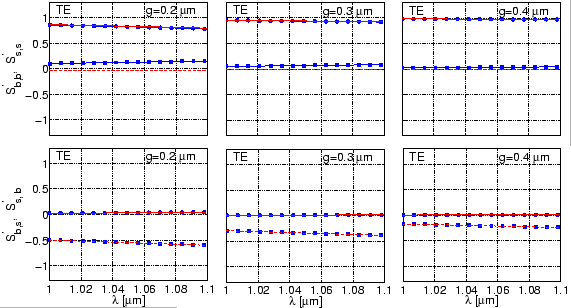
slight change. But the plots of the real and imaginary parts of
in
Figure 3.6, although for the TM modes one can observe a
slight change. But the plots of the real and imaginary parts of
![]() clearly bring forward the essence of the discussion in
Section 4.3. While the corresponding plots in
Figure 3.7 show considerable oscillations, the curves in
Figure 4.4 are almost linear such that
clearly bring forward the essence of the discussion in
Section 4.3. While the corresponding plots in
Figure 3.7 show considerable oscillations, the curves in
Figure 4.4 are almost linear such that
![]() can be reliability interpolated.
can be reliability interpolated.
 |
 |
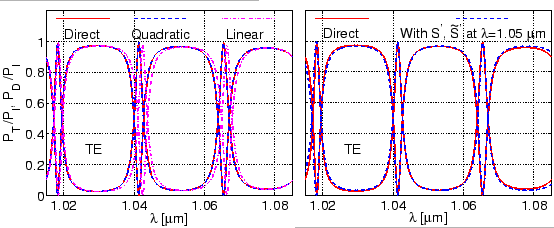
The left side plots of Figure 4.5 shows the
resonator spectrum as obtained by interpolating bend mode propagation
constants and CMT scattering matrices for only two (linear interpolation) or
three different wavelengths (quadratic interpolation), according to
Section 4.3. While small deviations remain for the linear approximation,
on the scale of the figure the curves related to quadratic interpolation are
hardly distinguishable from the direct CMT results. Thus the interpolation
approach provides a very effective means to predict the resonator spectrum, in
particular if narrow dips /peaks in the responses of high-quality resonators
would have to be resolved.
 |
In Section 1.4.3 we discussed an approximate spectrum
evaluation method, where one assumes that for a narrow wavelength
interval the scattering matrices are approximately constant, and the resonances
are ``exclusively'' due to the phase gains experienced by the cavity modes
while propagating along the cavity. By using the scattering matrices
![]() and
and
![]() (corresponding to a total cavity length of
(corresponding to a total cavity length of
![]() ), we can verify this approximation. In fact according to the right
part of Figure 4.5, this scenario is quite well
realized. For the present configuration with a low loss cavity mode, the
spectrum evaluated with
), we can verify this approximation. In fact according to the right
part of Figure 4.5, this scenario is quite well
realized. For the present configuration with a low loss cavity mode, the
spectrum evaluated with
![]() ,
,
![]() at
at
![]() m and a wavelength dependent propagation constant
m and a wavelength dependent propagation constant
![]() agrees quite well with ``direct'' CMT calculations. Note that, far from the
reference wavelength
agrees quite well with ``direct'' CMT calculations. Note that, far from the
reference wavelength
![]() m, the approximation of constant
matrices
m, the approximation of constant
matrices
![]() ,
,
![]() slightly deteriorates.
slightly deteriorates.
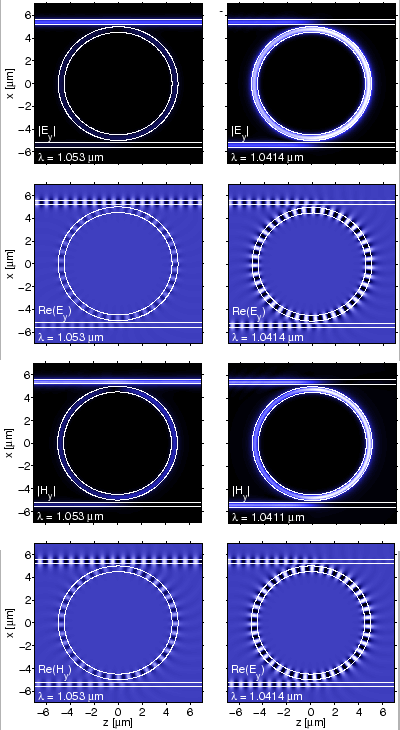
Beyond modal amplitudes and power levels, the CMT solutions permit to access the full optical electromagnetic field. Figure 4.6 collects plots of the principal components for off resonance and resonant configurations for both polarizations. Off resonance, one observes the large Through transmission, small amplitudes of the waves in the Drop-port, and also only minor wave amplitudes in the cavity. At the resonances, the straight transmission is almost completely suppressed; the major part of the input power arrives at the Drop-port. For the present strongly coupled configurations, the power that enters and leaves the cavity at the two couplers leads to considerably different field intensities in the left and right halves of the ring. Here the radiative parts of the bend modes are appreciable outside the cavity, in particular for the more lossy TM waves.
 |