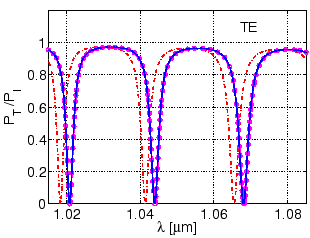
With the help of Eq. (4.16), the shifts in the (real part of)
the cavity mode propagation constants at the resonance wavelengths of the
unperturbed resonators are calculated; Eq.(4.15) then gives the
shifts in the resonance wavelengths. Adding these differences to the
unperturbed resonance wavelengths, determines the resonance positions for the
perturbed configuration, which are compared with the resonance positions
obtained by direct CMT simulations for the perturbed (
![]() ) resonator. Figure 4.21 depicts the spectral responses
for the perturbed and the unperturbed ring resonators. The spectral response
computed with the method outlined in this section agrees with the direct CMT
calculation. Thus for a small perturbation of the cavity core refractive
index, using the scattering matrices and the cavity propagation constants of
the unperturbed structure, and the shifts in the cavity mode propagation
constants, one can quite reliably predict the spectral response for the
perturbed resonator.
) resonator. Figure 4.21 depicts the spectral responses
for the perturbed and the unperturbed ring resonators. The spectral response
computed with the method outlined in this section agrees with the direct CMT
calculation. Thus for a small perturbation of the cavity core refractive
index, using the scattering matrices and the cavity propagation constants of
the unperturbed structure, and the shifts in the cavity mode propagation
constants, one can quite reliably predict the spectral response for the
perturbed resonator.
 |
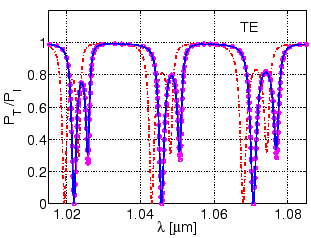
A similar comparison of the transmitted power for the unperturbed and the perturbed disk resonator is shown in Figure 4.22. Just as in the case of the monomodal ring, for the present multimodal disk we find that the perturbed resonator spectrum computed by the approximation method (solid line) discussed in this section agrees well with the direct CMT simulations (circles), what concerns the resonance positions.
Minor deviations are observed in the depths of the resonance dips, in
particular for the TE![]() resonances, where apparently the change in modal
attenuation due to the core refractive index change is slightly larger than
for the TE
resonances, where apparently the change in modal
attenuation due to the core refractive index change is slightly larger than
for the TE![]() mode. This alteration of the cavity mode losses is not taken
into account by the present approximation procedure.
mode. This alteration of the cavity mode losses is not taken
into account by the present approximation procedure.
 |