 |
 |
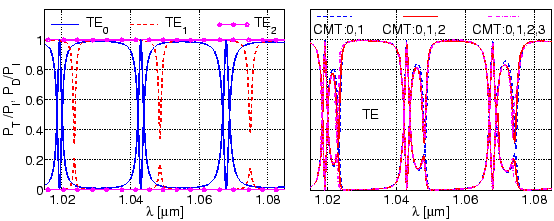
one must expect that more or less pronounced features related to all of these basis fields appear in the resonator spectrum. Figure 4.7 allows to investigate the significance of the individual cavity modes on the spectral response predicted by the CMT analysis.
The plots of Figure 4.7 show the spectral response as obtained by
CMT computations where, besides the mode of the straight waveguide, different
sets of bend modes are used as basis fields. The curves related to
calculations with single cavity modes (left) exhibit only specific extrema of
the full spectrum with similar extremal levels; obviously these resonances can
be assigned to the respective (TE![]() or TE
or TE![]() ) whispering gallery mode. As
these modes circulate along the cavity with their different propagation
constants, individual resonance conditions are satisfied in general at
different wavelengths. Apparently the regime discussed at the end of
Section 4.1 is realized here (cf. also the tiny bend mode cross
coupling coefficients
) whispering gallery mode. As
these modes circulate along the cavity with their different propagation
constants, individual resonance conditions are satisfied in general at
different wavelengths. Apparently the regime discussed at the end of
Section 4.1 is realized here (cf. also the tiny bend mode cross
coupling coefficients
![]() in
Figure 3.11).
in
Figure 3.11).
While the fundamental and first order bend mode are essential for the present resonator, inclusion of the second order whispering gallery mode into the CMT analysis leads only to minor, the third order bend field to no visible changes of the curves in the right plot of Figure 4.7. Thus for this microdisk configuration it is sufficient to take into account the three lowest order cavity modes as basis fields to predict reliably the spectral response.
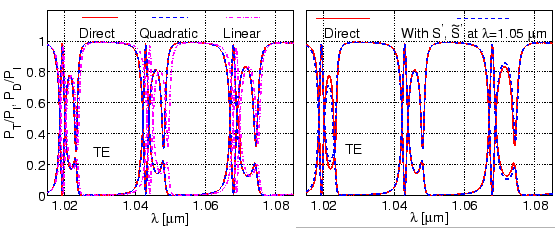
The left plot of Figure 4.8 allows to validate the
interpolation approach of Section 4.3 for the spectrum evaluation; just
as in Section 4.4.1 one finds that the quadratic interpolation of
the scattering matrix coefficients and propagation constants leads to curves
that are almost indistinguishable from the directly computed results. The
spectrum computed with the approximation technique of
Section 1.4.3 is shown in the plots on right side
Figure 4.8.
Using constant scattering matrices
![]() ,
,
![]() evaluated
at
evaluated
at
![]() m along with the wavelength dependent cavity mode
propagation constants, computed spectrum (dashed line) agrees
quite well with the strictly wavelength dependent calculations (solid
line). On the scale of the figure, the locations of the resonances predicted
by this approximation match with those corresponding to the ``direct''
calculations; but away from the reference wavelength
m along with the wavelength dependent cavity mode
propagation constants, computed spectrum (dashed line) agrees
quite well with the strictly wavelength dependent calculations (solid
line). On the scale of the figure, the locations of the resonances predicted
by this approximation match with those corresponding to the ``direct''
calculations; but away from the reference wavelength
![]() m, the
TE
m, the
TE![]() extrema levels differ slightly. Anyway, here one can accept the line of
arguments in Section 1.4.3 as a very good approximation.
extrema levels differ slightly. Anyway, here one can accept the line of
arguments in Section 1.4.3 as a very good approximation.
 |
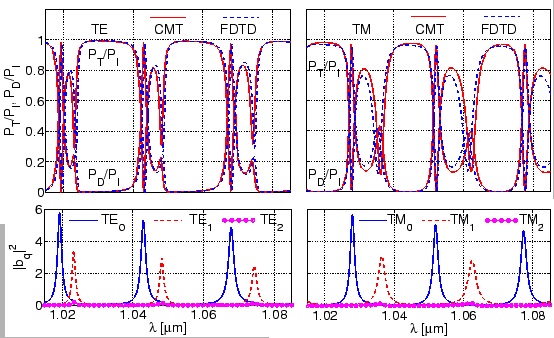
Figure 4.9 compares the CMT spectra for TE and TM polarized
light with rigorous FDTD calculations, where the simulation parameters are
identical to those given in Section 4.4.1. There is a quite
satisfactory agreement; as before minor deviations occur for the
configurations with highly radiative, strongly interacting, and less regular
fields in the TM case. The computational effort required for the CMT analysis
is about two orders of magnitude lower than the effort required for the FDTD
simulations.
 |
As an alternative to the computations of Figure 4.7, the
inspection of the amplitudes of the basis modes that establish inside the
cavity for varying wavelength provides a direct means for labeling the
spectral features. The plots in the second row of Figure 4.9
identify the narrower, most pronounced resonances as belonging to the
fundamental cavity modes, while the wider, less pronounced peaks are due to
the first order whispering gallery fields.
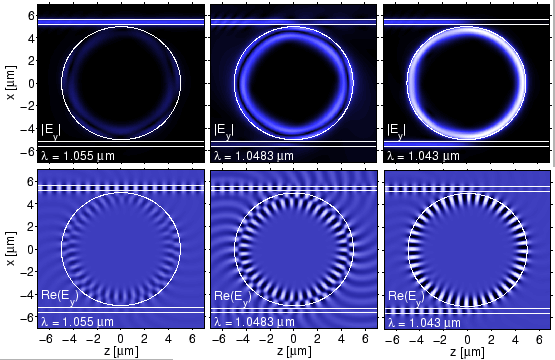
Figure 4.10 gives an impression of the field distributions that accompany the resonance phenomena. Off resonance, most of the input power is directly transferred to the Through-port. At the wavelength corresponding to the minor resonance, the field pattern in the cavity exhibits a nearly circular nodal line that corresponds to the radial minimum in the profile of the first order whispering gallery mode (cf. Figure 3.8). According to Figure 4.9, here the first order mode carries most of the power inside the cavity. The deviation form the circular pattern is caused by the interference with the fundamental bend mode, which is also excited at this wavelength with a small power fraction. The major resonance related to the fundamental mode is of higher quality, with much larger intensity in the cavity, almost full suppression of the waves in the Through-port and nearly complete drop of the input power.
 |