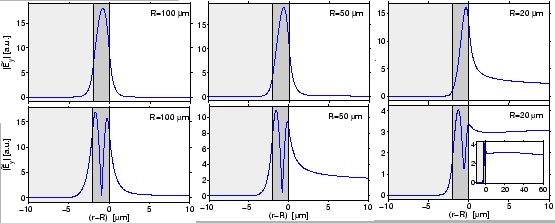
Just as for the fundamental fields, the attenuation of the first order modes grows with decreasing bend radius. Figure 2.7 shows that the significantly higher loss levels of the first order modes are accompanied by larger field amplitudes in the exterior region and by a wider radial extent of the mode profiles.
 |
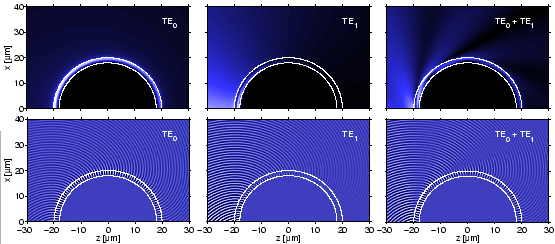
Figure 2.8 illustrates the spatial evolution of the TE![]() and
TE
and
TE![]() modes for a small configuration with
modes for a small configuration with
![]() m. Major differences
between the plots for the single fundamental and first order fields are the
faster decay of the TE
m. Major differences
between the plots for the single fundamental and first order fields are the
faster decay of the TE![]() mode and the minimum in the radial distribution of
that field.
mode and the minimum in the radial distribution of
that field.
 |
The last column of Figure 2.8 gives an example for an interference
pattern that is generated by a superposition of both modes. Normalized
profiles with unit amplitudes and real, positive
![]() are
initialized at
are
initialized at
![]() , or
, or ![]() , respectively (cf. Figure 2.1).
In the core region one observes the familiar beating process, here in the
angular direction, with intensity maxima shifting periodically between the
center and the outer rim of the ring. In the exterior region, the mode
interference results in a ray-like pattern, where rapidly diverging bundles of
waves propagate in directions tangential to the ring, originating from regions
around the intensity maxima at the outer ring interface. These phenomena are
obscured by the fast decay of the first order mode.
, respectively (cf. Figure 2.1).
In the core region one observes the familiar beating process, here in the
angular direction, with intensity maxima shifting periodically between the
center and the outer rim of the ring. In the exterior region, the mode
interference results in a ray-like pattern, where rapidly diverging bundles of
waves propagate in directions tangential to the ring, originating from regions
around the intensity maxima at the outer ring interface. These phenomena are
obscured by the fast decay of the first order mode.
Apart from the fundamental and first order fields, further higher order modes
can be found for the bent slabs of Table 2.3. While the TE![]() and
TE
and
TE![]() modes considered so far can be viewed as being related to the guided
modes supported by a straight slab with the same refractive index profile and
thickness, the profiles shown in Figure 2.9 are not related to
guided modes of that straight waveguide.
modes considered so far can be viewed as being related to the guided
modes supported by a straight slab with the same refractive index profile and
thickness, the profiles shown in Figure 2.9 are not related to
guided modes of that straight waveguide.
For these modes, the classification by the number of minima in the absolute value of the mode profile can still be applied; also the systematics of larger attenuation and higher exterior field levels for growing mode order remains valid.
 |
In contrast to the two lowest order fields, these higher order modes exhibit pronounced intensity maxima in the interior region. Apparently, for the present nonsymmetric bend, this indicates the transition to the regime of whispering gallery modes, which is discussed below.