 |
 |
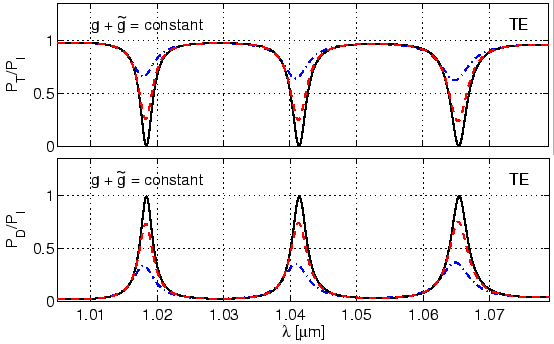
While for the off-resonance wavelengths there are hardly any differences,
close to the resonance wavelengths, one can observe substantial changes. As
seen from the right plot of Figure 4.16, for growing ![]() with
with
![]() , the through power steadily decreases and the drop power steadily
increases (also see Figure 4.18). As discussed before, for
, the through power steadily decreases and the drop power steadily
increases (also see Figure 4.18). As discussed before, for
![]() , at resonance there is complete transfer of the input power to
the drop port. For larger
, at resonance there is complete transfer of the input power to
the drop port. For larger ![]() with
with
![]() , the reverse effect takes
place, i.e. the through power steadily increases, and the drop power steadily
decreases.
, the reverse effect takes
place, i.e. the through power steadily increases, and the drop power steadily
decreases.
For constant
![]() , the simulations of Figure 4.18
systematically investigate the consequence of shifting the cavity closer to
the lower straight waveguide. It will be equally interesting to investigate
the effect of shifting the cavity closer to the upper (input) waveguide. For
this, it is sufficient to know the influence of interchanging the separation
distances
, the simulations of Figure 4.18
systematically investigate the consequence of shifting the cavity closer to
the lower straight waveguide. It will be equally interesting to investigate
the effect of shifting the cavity closer to the upper (input) waveguide. For
this, it is sufficient to know the influence of interchanging the separation
distances ![]() and
and ![]() on the spectral response.
on the spectral response.
 |
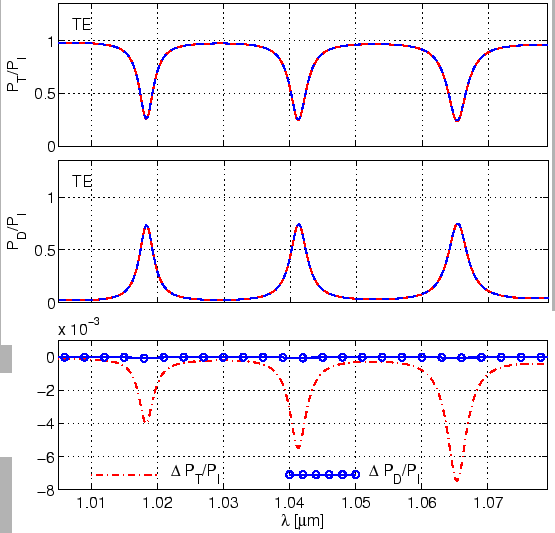
As an illustration, Figure 4.19 compares the ring resonator
spectral response for
![]() m,
m,
![]() m and
m and
![]() m,
m,
![]() m. On the scale of the figure, the curves (solid line and
dashed line) for the through power (first row) and the dropped power (second
row) are almost indistinguishable. But when the difference between the two
results is plotted (third row), one sees that power through for the setting
m. On the scale of the figure, the curves (solid line and
dashed line) for the through power (first row) and the dropped power (second
row) are almost indistinguishable. But when the difference between the two
results is plotted (third row), one sees that power through for the setting
![]() m,
m,
![]() m is more than that for
m is more than that for
![]() m,
m,
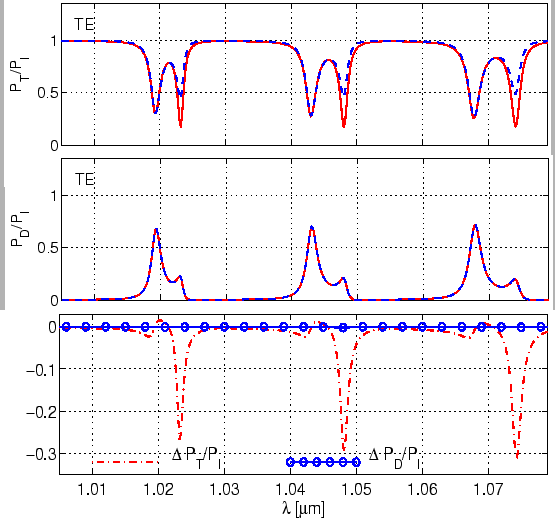
![]() m, whereas the drop power is equal in both cases. The
same behaviour is also observed in case of corresponding simulations for the
disk resonator, which are shown in Figure 4.20. In that case, one
can clearly distinguish the two through power curves around the resonances of
the TE
m, whereas the drop power is equal in both cases. The
same behaviour is also observed in case of corresponding simulations for the
disk resonator, which are shown in Figure 4.20. In that case, one
can clearly distinguish the two through power curves around the resonances of
the TE![]() mode. But in both cases, the dropped power remains unchanged.
mode. But in both cases, the dropped power remains unchanged.
 |
The invariance of the drop power for interchange of ![]() and
and ![]() can
be explained by flipping the resonator along the
can
be explained by flipping the resonator along the ![]() axis, and using
axis, and using
![]() from Eq. (4.6).
from Eq. (4.6).
This can also be explained by using Eq. (4.9) . For the
resonator setting as in Figure 4.1 (symmetrical around the
plane ![]() ), interchanging the separation distances
), interchanging the separation distances ![]() and
and ![]() is
equivalent to changing the setting with input at port A to a setting,
where port
is
equivalent to changing the setting with input at port A to a setting,
where port
![]() is excited.
is excited.
According to Eq. (4.9), the power at port
![]() for
for
![]() and
and
![]() , which is the drop power with
, which is the drop power with
![]() m,
m,
![]() m, is the same as the power at port
B for
m, is the same as the power at port
B for
![]() and
and
![]() , which is the drop
power with
, which is the drop
power with
![]() m,
m,
![]() m. Hence the difference between
the drop powers for the two settings (depicted by a line with circles in the
bottom plot of Figures 4.19, 4.20) is zero.
m. Hence the difference between
the drop powers for the two settings (depicted by a line with circles in the
bottom plot of Figures 4.19, 4.20) is zero.
What concerns the nonnegligible difference in the throughput power
(dash-dotted line in the last plots of Figure 4.19,
4.20, one can consider the ``ideal'' resonator discussed in
context of Eq. (4.12). If the attenuation corresponding to the
propagation along the cavity is negligible, i.e.
![]() for the
cavity mode, and if the coupling is lossless, then for monomodal port
waveguides, one has
for the
cavity mode, and if the coupling is lossless, then for monomodal port
waveguides, one has
| (4.13) | |||
| (4.14) |
From the Eq. (4.9), one has
![]() , which leads to
, which leads to
![]() , i.e. for the low loss
resonator, given input only at port A, the output power at port
B is exactly the same as the output power at port
, i.e. for the low loss
resonator, given input only at port A, the output power at port
B is exactly the same as the output power at port
![]() for input given only at port
for input given only at port
![]() . Or in the other words,
interchanging
. Or in the other words,
interchanging ![]() and
and ![]() does not affect the through power.
does not affect the through power.
For the ring resonator in Figure 4.19, such an ``ideal''
situation is realized (see Figure 3.2, a well guided cavity mode,
and Figure 3.4, almost lossless coupling). Therefore the difference in
the throughput power for these simulations is quite small. As the wavelength
increases, the attenuation of the cavity mode increases, resulting in
corresponding growing deviation
![]() . This can
be clearly seen for the resonances of the TE
. This can
be clearly seen for the resonances of the TE![]() mode.
mode.
The simulations of the disk resonator in Figure 4.20,
involve a substantially lossy TE![]() whispering gallery mode (see
Figure 3.8). Here
whispering gallery mode (see
Figure 3.8). Here
![]() , which
is evident from the significant difference of the through power
, which
is evident from the significant difference of the through power
![]() . Apart from the minor differences near the resonances of the
TE
. Apart from the minor differences near the resonances of the
TE![]() mode, one can see the pronounced deviations near the resonances of the
TE
mode, one can see the pronounced deviations near the resonances of the
TE![]() mode.
mode.
It should be emphasized that the invariance of the dropped power for interchanging the gaps can be used as an additional check of the consistency of the model. The almost perfect agreement of the the curves for the dropped power in Figures 4.19 and 4.20 shows that the present CMT based model of microresonators satisfies this constraint very well.