 |
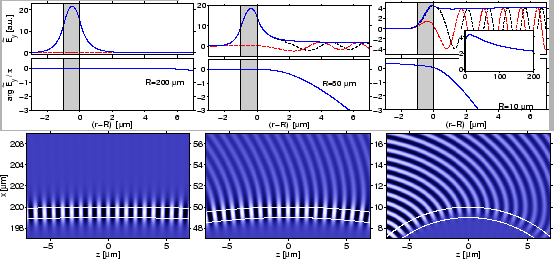
Beyond the values of the propagation constants, the present analytical mode solver permits to evaluate modal fields for the full range of radial coordinates. Figure 2.4 illustrates normalized profiles for a few fundamental TE bend modes of the configurations considered in Table 2.1.
 |
One observes the expected effects [93,43]: Bends with large
radii ![]() support modes with almost the familiar symmetric, well confined
plane profiles of straight symmetric slab waveguides. With decreasing bend
radius, the phase profiles of the bend modes become more and more curved.
Along with the increasing attenuation, the maximum in the absolute value of
the basic electric field shifts towards the outer rim of the bend, and the
relative field levels in the exterior region grow. The mode profiles are
essentially complex, with oscillatory behaviour of the real- and imaginary
parts of the field profiles in the exterior region. The effects of ``bending''
and the lossy nature of the bend modes are illustrated best by the snapshots
of the physical fields in the second row of Figure 2.4.
support modes with almost the familiar symmetric, well confined
plane profiles of straight symmetric slab waveguides. With decreasing bend
radius, the phase profiles of the bend modes become more and more curved.
Along with the increasing attenuation, the maximum in the absolute value of
the basic electric field shifts towards the outer rim of the bend, and the
relative field levels in the exterior region grow. The mode profiles are
essentially complex, with oscillatory behaviour of the real- and imaginary
parts of the field profiles in the exterior region. The effects of ``bending''
and the lossy nature of the bend modes are illustrated best by the snapshots
of the physical fields in the second row of Figure 2.4.
 |
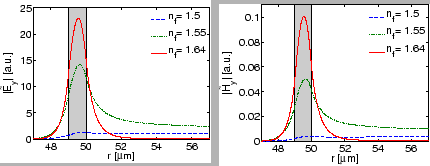
Just as for straight waveguides, the confinement of the bend modes depends
critically upon the refractive index contrast. As exemplified by
Figure 2.5, one observes quite similar effects when the core
refractive index of the bend is varied, as found for the change in bend
radius: With loosened confinement and growing attenuation for decreasing
![]() , the mode profile maximum shifts towards the outer rim, and the
relative field levels in the exterior region increase. Note that all
(normalizable) mode profiles decay for large radial coordinates according to
Eqs. (2.6) and (2.17), despite their appearance in
Figs. 2.4 and 2.5 (See the insets in
Figs. 2.4, 2.7, 2.9).
, the mode profile maximum shifts towards the outer rim, and the
relative field levels in the exterior region increase. Note that all
(normalizable) mode profiles decay for large radial coordinates according to
Eqs. (2.6) and (2.17), despite their appearance in
Figs. 2.4 and 2.5 (See the insets in
Figs. 2.4, 2.7, 2.9).