

Next: Changing only one of
Up: Influence of separation distance
Previous: Influence of separation distance
Contents
Changing both separation distances identically
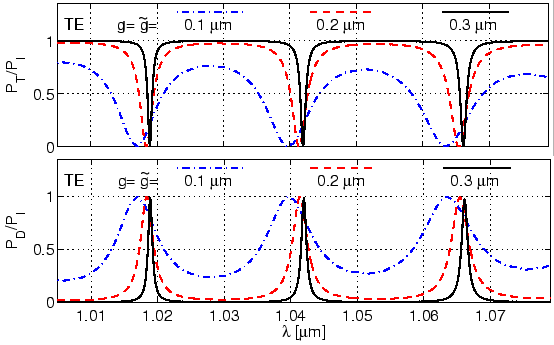
Figure 4.13 shows the effect of symmetrical changes of both
separation distances on the spectral response. As evident from
Figures 3.4, 3.11, as the distances  ,
,  are reduced,
the cross coupling between the straight waveguide and the cavity increases,
and the self coupling decreases. Due to the reduced self coupling of the upper
straight waveguide, the nonresonant level of throughput power decreases;
whereas as more power is coupled from the upper waveguide to the cavity, and
then from the cavity to the lower waveguide, the nonresonant level of drop
power increases.
Figure 4.13:
Spectral response of a ring resonator
for different gap widths. The resonator configuration is as in
Figure 4.5.
 |
Due to the increased cavity self coupling (
 S
S ), as seen
from Eq. (1.15), the FWHM decreases. This is clearly
revealed in plots of Figure 4.13. As shown in
Table 4.5, there is also a change in the resonance
positions, here defined as the wavelengths corresponding to the extrema in the
transmitted and the dropped power.
Table:
Resonance positions of the ring
resonator of Figure 4.5, for different
separation distances
 . For large separations, the resonance
positions computed by the CMT based simulations tend to the
eigenfrequencies of the ``isolated'' ring cavity [39, private
communication].
 m m![$ ]$](img419.png) |
TE resonance wavelengths [ resonance wavelengths [
 m] m] |
 |
 |
 |
 |
 |
 |
 |
 |
 |
 |
 |
 |
 |
 |
 |
 |
 |
 |
 |
 |
 |
 |
 |
 |
| eigenfrequencies |
 |
 |
 |
|
|
|
|
|
For larger separation distances, the influence of neighboring straight
waveguides on the cavity field propagation is marginal, and the resulting
resonances of the microresonator (cavity coupled to two straight waveguides)
tend to resonances of the ``isolated'' cavity. The comparison with resonance
wavelengths of the isolated cavity obtained by the complex eigenfrequency
model [39], shown in Table 4.5, confirms this fact.
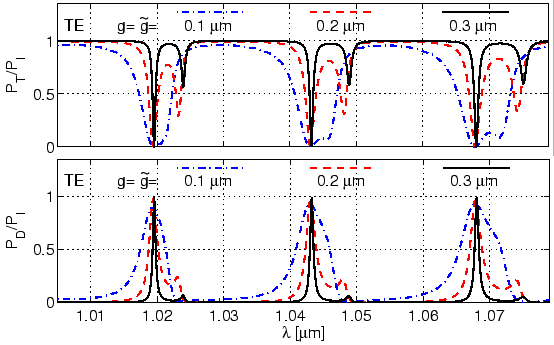
The same trend is observed in case of a resonator with a disk cavity, see
Figure 4.14 and Table 4.6. The disk resonance
wavelengths will converge to the wavelength corresponding to the
eigenfrequencies of the isolated disk (note that corresponding data for
eigenfrequencies of the isolated disk was not available).
Figure 4.14:
Spectral response of disk resonators
as in Figure 4.8 with different coupler gaps. The
plots show the resonances of the TE mode (the pronounced extrema)
and of the TE
 mode (the secondary extrema). The CMT simulations involve
the first three WGMs.
 |
Table:
Resonance positions of the disk
resonator of Figure 4.8, for different
separations
 . Note that for
 m, the broad
peaks related to the TE
 and TE
 resonances interfere strongly.
| |
Resonance wavelengths [
 m] m] |
 [ [
 m] m] |
TE |
TE |
| 0.1 |
1.01952 |
1.04311 |
1.06787 |
- |
1.04559 |
1.07161 |
| 0.2 |
1.01937 |
1.04307 |
1.06790 |
1.02324 |
1.04813 |
1.07430 |
| 0.3 |
1.01953 |
1.04324 |
1.06809 |
1.02394 |
1.04893 |
1.07520 |
| 0.4 |
1.01962 |
1.04334 |
1.06820 |
1.02425 |
1.04928 |
1.07562 |
| 0.5 |
1.01966 |
1.04340 |
1.06826 |
1.02440 |
1.04946 |
1.07584 |
| 0.6 |
1.01969 |
1.04342 |
1.06829 |
1.02449 |
1.04957 |
1.07596 |
|


Next: Changing only one of
Up: Influence of separation distance
Previous: Influence of separation distance
Contents
Kirankumar Hiremath
2005-09-23


![]() S
S![]() ), as seen
from Eq. (1.15), the FWHM decreases. This is clearly
revealed in plots of Figure 4.13. As shown in
Table 4.5, there is also a change in the resonance
positions, here defined as the wavelengths corresponding to the extrema in the
transmitted and the dropped power.
), as seen
from Eq. (1.15), the FWHM decreases. This is clearly
revealed in plots of Figure 4.13. As shown in
Table 4.5, there is also a change in the resonance
positions, here defined as the wavelengths corresponding to the extrema in the
transmitted and the dropped power.
